 takes on...
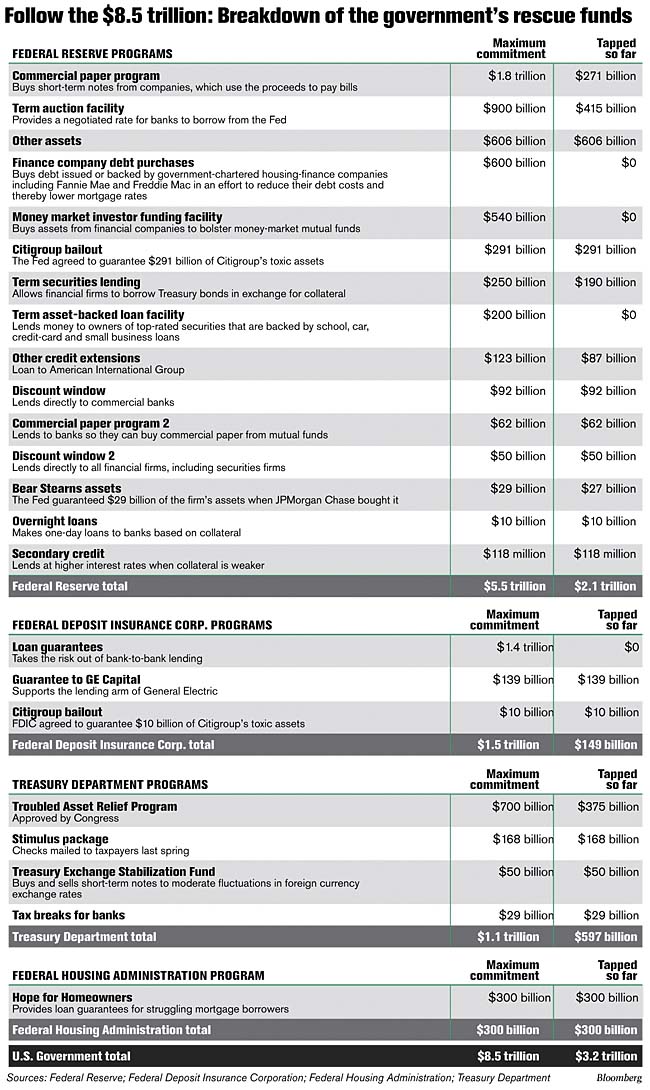
I'm a little upset by all of the bailout programs coming out of Washington. I can't keep track anymore. There is the TARP and the TALF, the two stimulus packages, numerous bailouts for banks, Bear and AIG, and the purchasing of Treasuries by the Fed. A trillion here, a trillion there... Some place total spending estimates now at $8.5 trillion! Here is one count by The Centre for Research on Globalization.
Now, I have said before that I like these programs. I think this is what the government should be doing. However, I do not believe that this problem is one that we can just throw money at. These toxic assets are considered toxic for a reason. Most were created by physicists and mathematicians to be very complex, dynamic securities with many complexities that make valuing them very difficult. They used a mix of dynamic traunching and derivatives like swaps to hedge away risks in the loan portfolios. (Which only work when the counter parties are solvent!) This article gives a good idea of the complexity of these instruments. Valuing these toxic assets continues to be an issue, as it was with the first bailout, when members of Congress grilled Ben Bernanke on how the government could value these assests better than the market can.
I believe that this issue is at the core of the credit crisis. Any plan to fix the credit crisis without dealing with this problem is a waste of time and money. Some of these structured products are so complex that I believe the only solution is to purchase them back from their holders, restructure them, and return them to the owner. This process will remove the complexities of the securities so that individuals can see what they are, rate them accordingly, and value them properly.
What I'm suggesting is no easy task. But this must be done to obtain clarity on what loans underlie these complex securities. Only after we have clarity on these loans can we then move to discussions on mark to market accounting and the like. For more details on exactly what I'm talking about, I recommend this book
Wednesday, March 25, 2009
Friday, February 6, 2009
Pairs Trading Can Be Risky!
So, I thought I’d check up on a pairs trade that I was considering entering last March. Pairs trading involves taking advantage of a correlation between two markets or stocks. When the pairs diverge, you short the higher one and buy the lower one, hoping that they will come back together in the future, and you will capture the difference as profit.
I noted one such divergence between the oil market and the clean energy sector. They usually are highly correlated because higher oil prices makes investment in alternative energy technologies more attractive. Early last year, as oil went on its historic bull run, the correlation broke down. I saw an opportunity for a pairs trade emerge. The chart below shows the divergence:
 (from Yahoo Finance)
Looking deeper into the pair, the correlation coefficient is 0.49, which is quite a bit lower than the 0.70 that some people consider a minimum for a significant correlation. However, I like the logical argument behind the correlation and attribute the low coefficient to my small data set that only goes back to 2006.
The point of this article is that, sometimes, markets can irrationally diverge for longer than you can stay solvent. Even a hedged pairs trade can be very risky under leverage. But, if you’re careful and patient, you can make money in a logical way!
Tuesday, February 3, 2009
GDP Growth? Or Not?
The way that GDP is reported by our government always frustrated me. The calculation of GDP includes government spending. What this means is that it's possible for the government to borrow money and "create" GDP out of thin air. This is why fiscal policy is so important to the economy.
So, does the government influence GDP with fiscal policy? Of course. I'd like to focus on the most recent Bush administration. During the last 8 years, the economy grew at a small but pretty even rate. However, at the same time, we ran record deficits. So, did the Bush administration create a growing GDP by borrowing money on the

The graph above shows 3 lines. The blue line is the official reported GDP adjusted for inflation. The red line is the government account deficit/surplus. If the red line is above zero, then the government ran a surplus. If the red line is below zero, the government ran a deficit. The green line is GDP minus the government account deficit.
Note that when the government runs a deficit, corrected GDP is lower than reported GDP, because the government is borrowing money to stimulate the economy. When the government runs a surplus, the corrected GDP is higher, because the government is taking money out of the economy, via taxes, and paying off government debt instead of stimulating the economy.
There are some interesting things to note. During the late nineties, the economy was roaring on its own, as much as seven percent, while fiscal policy was paying off government debt. This would tend to show the
I should hope that Obama can learn from what is shown here, and implement sound economic policies that grow the economy, rather than deficit spending to cover up a bad GDP.
Friday, January 30, 2009
Correlation between VIX and Gold?
Some consider the VIX index as a measure of "market fear." Indeed, the index does depend on demand for S&P 500 puts, which is a good sign that portfolio managers are worried about a market drop. I have been thinking recently that gold is another measure of "market fear." When people become concerned about the economy and the solvency of the federal government (along with inflation), they buy gold.
So, we should be able to see a correlation between the VIX and gold, right?
Let's look into it. I'll plot the daily closing value of Gold on the vertical axis and the daily closing value of the VIX on the horizontal axis. My data set goes back to 1991 and contains over 4,000 data points.

What an interesting pattern we see here! I have to say, it does not look like what I was thinking it would look like. The only re-assuring aspects of the graph are the points in the top right (when gold is high, the VIX is high, signaling a correlation) and the points in the bottom left (gold is low, VIX is low, signaling a correlation). Most of the other points, however, do not signal a correlation.
One might argue that Gold is influenced by inflation, while the VIX is not. That would be a good argument. Here is the same graph with the gold price adjusted for inflation using the GDP deflator:

Not as much of a change as we would like. I still find this graph to be very interesting and hope others might be able to comment on it’s value…
Thursday, January 15, 2009
Buy Treasuries?
I really am having a hard time understanding some of these "experts" giving advice on where to put your money. Here's another example. His position is that things are going to get worse. State and Municipal governments are going to have huge budget shortfalls this year and are going to require a bail-out by the federal government. His suggestion is to buy treasuries for safety.
Why, why, why would someone tell you to buy Treasuries right after they describe the huge amounts of debt that the government is going to have to take on? How do problems for state and munis cause a bad stock market? Where's the logic in this advisor's argument?
No one seemed to take note when some pointed out that the federal government could easily lose their AAA status. This article is from Sept 08! Think where we are now, with Obama pushing an $800 billion stimulus.
I've had enough of this "the world is ending" talk. Treasuries have peaked. It's time to sell.
Tuesday, January 6, 2009
Confirmation?
Today's news is a real vindication of my study. As mortgage rates continue to decline to record lows, real estate prices continue to sink. This would seem counter-intuitive, but it non-the-less frequently occurs.
However, I have no doubt that the decrease in mortgage rates will eventually provide a lift to the real estate market. The stock market has had a nice rebound, possibly signaling that the worst is over. It has been quite some time since we have had a headline about a major bank failing. All of the steps that the government has taken and the nature of the business cycle will, I believe, improve economic conditions in 2009.
Happy New Year!
Monday, December 22, 2008
Change Reserve Requirement?
I've been hearing that Ben Bernanke is using "every available tool" to spur the economy. Dropping interest rates to 0 and lending money freely have been drastic moves, but he is still not using every tool at his disposal.
The Fed has one tool that I haven't heard anybody talking about. The Fed sets the reserve requirement for banks. This power is considered by economists to be the "sledge hammer" of their powers, having a more dramatic impact on the economy than setting rates or making loans.
My question is, do we not need a "sledge hammer" right now? The use of this third power would directly impact the credit issues this country is experiencing. It would have a positive impact on banks that cannot loan because they have capital constraints.
While I'm not advocating lowering the reserve requirement forever, it is available to Ben Bernanke to use to try to get our country through this crisis.
Subscribe to:
Posts (Atom)


